Understanding Svelte – Tuning asynchrony and animation basics
In this post, we'll improve the opening of the historical prices panel so that it's not blocked by network requests and then add a simple opening animation.

In the last post, we added the ability to show historical prices in our crypto card. The panel opened when the user clicked the opening arrow.
In this post, we'll improve the opening of this panel so that it's not blocked by the network requests that fetch the historical prices and then add a simple animation to it.
Giving the user instant feedback
Currently, when the user wishes to see all the Bitcoin prices and expresses this wish by clicking the arrow that opens the panel holding them, we wait to display anything because we fetch the prices in a blocking way:
// src/CryptoCard.svelte
<script>
  // (...)
  async function showHistoricalPrices() {
    isExpanded = true;
    for (let label in labelMapping) {
      let days = labelMapping[label];
      let date = format(subDays(new Date(), days), 'yyyy-MM-dd');
      let priceInfo = await fetch(`https://api.coinbase.com/v2/prices/BTC-USD/spot?date=${date}`).then(r => r.json());
      prices[label] = priceInfo.data.amount;
    }
  }
</script>
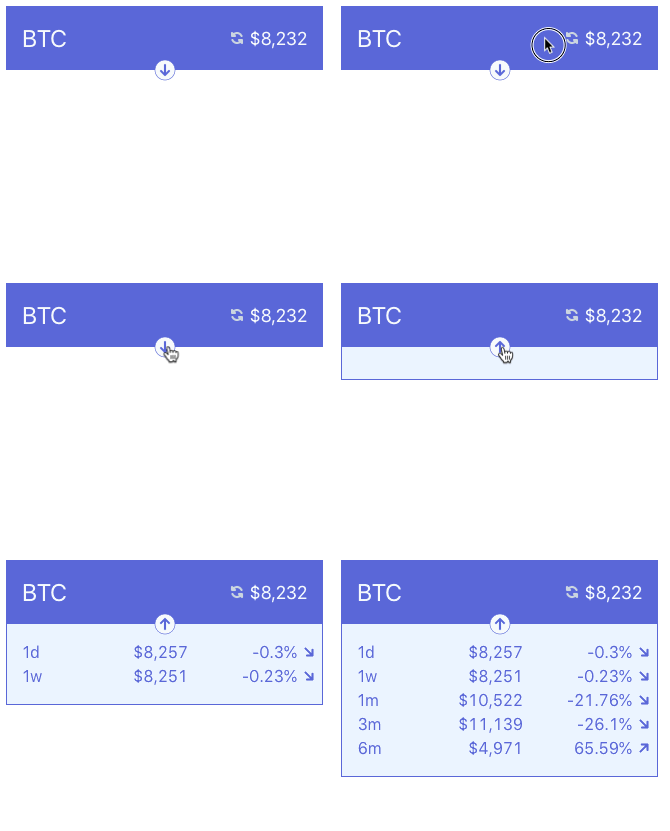
Note the await in the for loop: that will block each time a price is being fetched so prices are displayed one by one:

We could improve this by removing the blocking. The user would get instant feedback, the panel would open to its full length and prices would be updated as the network requests complete, concurrently.
If we can't wait for the network request to complete in the loop, what shall we do? Well, we can just take the promise returned by fetch and pass it into PriceRow. That means showHistoricalPrices runs in a heartbeat (actually, a lot faster) and we'll only "resolve" the promise (wait for the request) at the place where where it's needed, in PriceRow.
Some restructuring is thus needed:
<script>
  // (...)
  function showHistoricalPrices() {
    isExpanded = true;
    for (let label in labelMapping) {
      let days = labelMapping[label];
      let date = format(subDays(new Date(), days), 'yyyy-MM-dd');
      let promise = fetch(`https://api.coinbase.com/v2/prices/BTC-USD/spot?date=${date}`).then(r => r.json());
      prices[label] = promise.then(p => p.data.amount);
    }
  }
Really, the only thing that's changed is that the function is no longer an async one and the prices object contains promises as values that will resolve with the appropriate price – instead of containing the price itself.
Let's adjust the calling of PriceRow to reflect that:
<!-- src/CryptoCard.svelte -->
{#if isExpanded}
  <div class="historical-prices p-4 border border-t-0 border-indigo-600">
    <div class="table table-fixed w-full">
      {#each Object.keys(prices) as label}
        <PriceRow label={label} pricePromise={prices[label]} {currentPrice} />
      {/each}
    </div>
  </div>
{/if}
It's the task of the PriceRow component to go and get the price – that means resolving the promise that triggers the network request:
// src/PriceRow.svelte
// (...)
import { onMount } from 'svelte';

<script>
  // (...)
  export let pricePromise;
  let price;

  onMount(() => {
    pricePromise.then(value => {
      price = value;
    });
  })
  // (...)
</script>
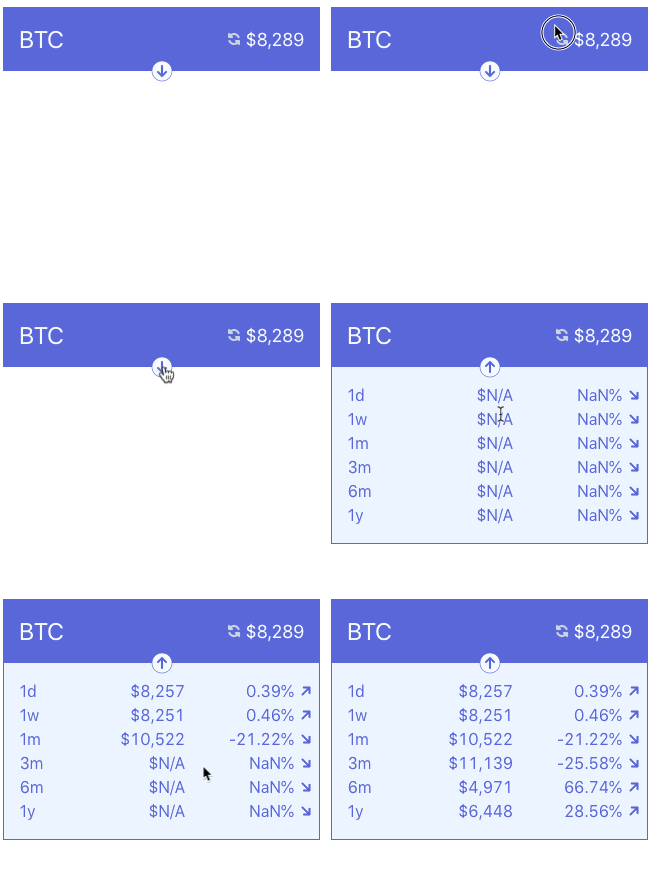
Nothing else needs to change. The expansion of the price panel has improved as we expected:

Let's add some guard code so that we only display existing values and not flavors of missing ones.
// src/PriceRow.svelte
<script>
  // (...)
  function change(current, old) {
    if (!old || !current) {
      return null;
    }
    current = parseFloat(current);
    old = parseFloat(old);
    return ((current - old) / old) * 100;
  }

  $: priceChange = round(change(currentPrice, price), 2) || 'N/A';
  $: formattedPrice = formatPrice(round(price, 0));
</script>


<div class="table-row">
  <label class="table-cell w-12 align-middle">{label}</label>
  <span class="table-cell w-24 text-right align-middle">{formattedPrice}</span>
  <span class="table-cell w-24 text-right align-middle">{priceChange}</span>
  <div class="table-cell w-2 align-middle">
    <IconArrow fill="#5A67D8" stroke="#5A67D8" strokeWidth="0.1px" rotation="{priceChange > 0 ? -135 : -45}" />
  </div>
</div>
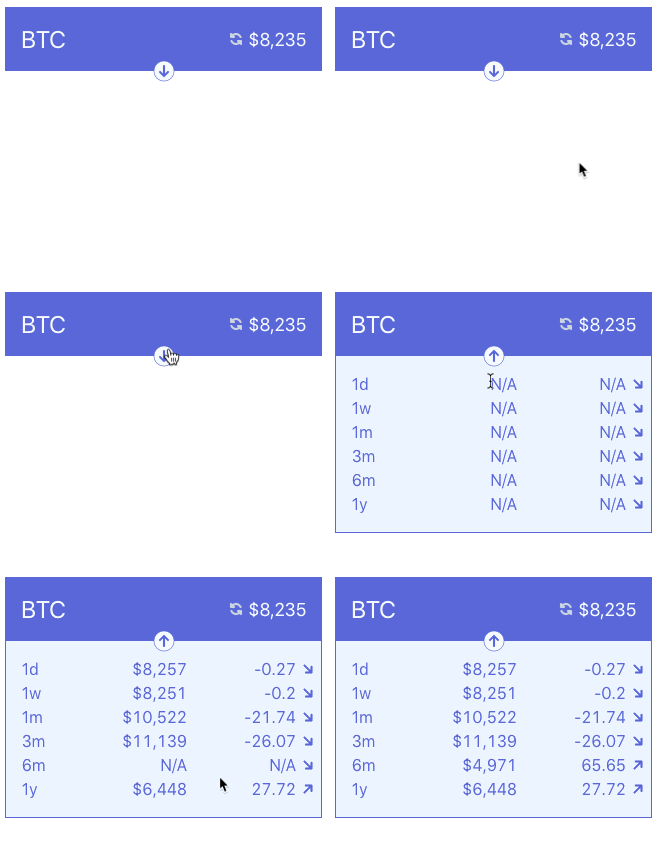
formatPrice already returns 'N/A' for a missing value so that should be all we need:

(The source code for IconArrow can be found here in a gist.)
Adding a dash of animation
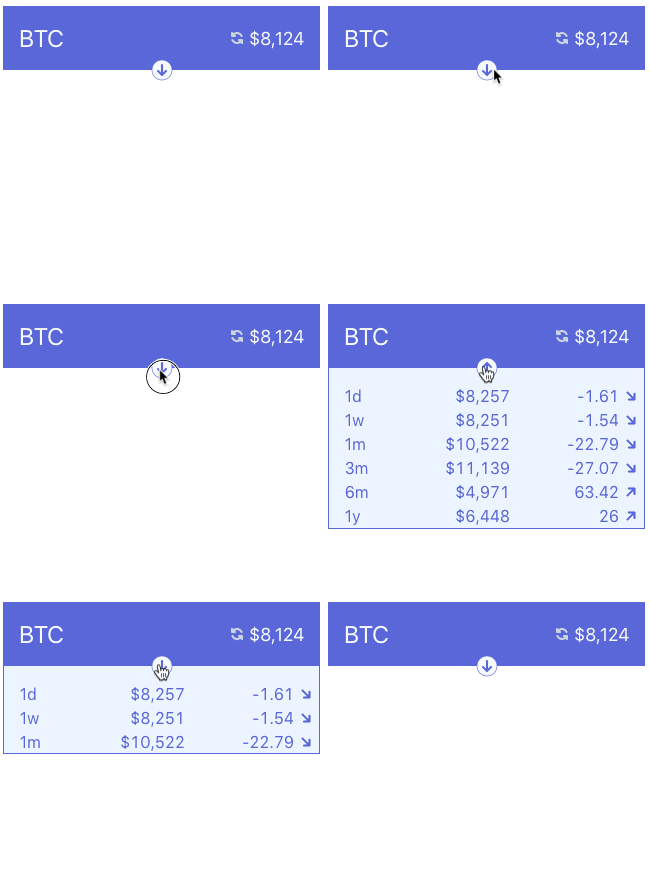
As a final touch, it'd be nice to have the panel slide down when opened instead of abruptly falling (see above). Another thing that Svelte makes quite easy is adding animations, let's see how.
<div class="historical-prices p-4 border border-t-0 border-indigo-600" transition:slideDown="{{ duration: 250 }}">
  <div class="table table-fixed w-full">
    {#each Object.keys(prices) as label}
      <PriceRow label={label} pricePromise={prices[label]} {currentPrice} />
    {/each}
  </div>
</div>
I added the transition attribute to the element we want to animate. transition:slideDown specifies that a function called slideDown is used for the animation. Further arguments can be passed to the transition function, like I did with transition:slideDown={{ duration: 250 }}.
The slideDown function receives the element that's being animated and needs to return a delay, the animation's duration and the css that gets applied to the element. We can thus write something similar:
import { circOut } from 'svelte/easing';
// (...)

<script>
  // (...)
  function slideDown(node, { duration=500 }) {
    let height = +getComputedStyle(node)['height'].match(/(\d+)px/)[1];
    return {
      delay: 0,
      duration,
      css: t => {
        return `height: ${circOut(t) * height}px`
      }
    }
  }
</script>
height is the final height of the element. The css parameter is a function that gets called repeatedly during the animation with t values between 0 and 1. Fortunately for us, Svelte provides around a dozen easing functions so that we can choose which one suits our needs best.
If we put a logpoint in the slideDown function, we'll get the following output:
height:  177 t: 0 current height: 0
height:  177 t: 0.066664 current height: 63.54371763579166
height:  177 t: 0.133328 current height: 88.30147439261059
height:  177 t: 0.199992 current height: 106.19811197377729
height:  177 t: 0.266656 current height: 120.33482401879955
height:  177 t: 0.33332 current height: 131.92589978632097
height:  177 t: 0.399984 current height: 141.59787595574934
height:  177 t: 0.466648 current height: 149.72313179293167
height:  177 t: 0.533312 current height: 156.54269765959006
height:  177 t: 0.5999760000000001 current height: 162.221325556027
height:  177 t: 0.6666400000000001 current height: 166.87553151292613
height:  177 t: 0.7333040000000002 current height: 170.58918444099302
height:  177 t: 0.7999680000000002 current height: 173.4227175335432
height:  177 t: 0.8666320000000003 current height: 175.41878560504716
height:  177 t: 0.9332960000000003 current height: 176.60578701598183
height:  177 t: 0.9999600000000004 current height: 176.99999985839997
height:  177 t: 1 current height: 177
Anyway, that's probably too much detail. The main thing is, the opening of historical prices now looks a lot more realistic (not sure if the animated gif does it justice):

Next up
We're getting into the swing of this.
There are so many things we can add. I'll probably pick being able to manually refresh the prices using the refresh icon and making it spin while they are being fetched.


