Understanding Svelte – Simple event handling and some more reactivity

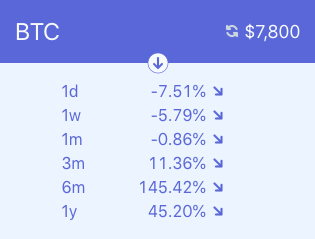
The last time we built a small crypto card (more like a label) that showed the current price of Bitcoin. In this post, we'll expand that to show historical prices. We'd like to end up with something like the following, only with real prices:

The markup for our crypto card looks as follows, with most of the css classes removed to reduce noise (I use Tailwind, a functional CSS library).
<div class="xs:w-full md:w-1/2 lg:w-1/6">
  <div class="main">
    <label>BTC</label>
    <div class="icon-holder">
      <IconRefresh fill="#CBD5E0" stroke="#CBD5E0" strokeWidth="0.1"/>
    </div>
    <span class="text-lg">${formattedPrice}</span>
  </div>
  <div class="icon-holder">
    <svg viewBox="0 0 24 24" xmlns="http://www.w3.org/2000/svg">
      <!-- The opener icon -->
      <circle cx="12" cy="12" r="10" stroke="#5A67D8" stroke-width="0.6" fill="#F7FAFC"/>
      <path d="m11 14.59v-7.59a1 1 0 0 1 2 0v7.59l2.3-2.3a1 1 0 1 1 1.4 1.42l-4 4a1 1 0 0 1 -1.4 0l-4-4a1 1 0 0 1 1.4-1.42z" fill="#5A67D8" stroke="#5A67D8" stroke-width="0.1" />
    </svg>
  </div>
  <div class="historical-prices">
    <div class="table mx-auto">
      <PriceRow label="1d" priceChange="-7.51" />
      <PriceRow label="1w" priceChange="-5.79" />
      <PriceRow label="1m" priceChange="-0.86" />
      <PriceRow label="3m" priceChange="11.36" />
      <PriceRow label="6m" priceChange="145.42" />
      <PriceRow label="1y" priceChange="45.20" />
    </div>
  </div>
</div>
There's a new component, `PriceRow`, that's responsible for displaying one historical price change. Currently, the values are static. That component looks like that:
// src/PriceRow.svelte
<script>
  import IconArrow from './IconArrow.svelte';

  export let label;
  export let priceChange;
</script>

<style>
  span {
    font-feature-settings: "tnum";
  }
</style>

<div class="table-row">
  <label>{label}</label>
  <span>{priceChange}%</span>
  <div class="table-cell">
    <IconArrow fill="#5A67D8" stroke="#5A67D8" strokeWidth="0.1px" rotation="-45" />
  </div>
</div>
If you want to build the project along with me, here's the source of the IconArrow and IconRefresh components.
The first thing we should fix is that the arrow indicating the price change is wrong. It always points downwards, indicating a price decrease although we do have positive changes for longer term values.
The fix is done through a reactive declaration:
// src/PriceRow.svelte
<script>
  // (...)
  $: hasPriceIncreased = Number(priceChange) > 0;
</script>

<div class="table-row">
  <label>{label}</label>
  <span>{priceChange}%</span>
  <div class="table-cell">
    <IconArrow fill="#5A67D8" stroke="#5A67D8" strokeWidth="0.1px" rotation="{hasPriceIncreased ? -135 : -45}" />
  </div>
</div>
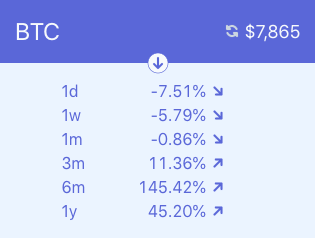
The arrow direction is now fixed:

Our first event handler
Let's now hide the prices until the panel is expanded by clicking the downward pointing arrow icon. We'll do this by implementing a state flag that we name isExpanded:
<script>
  // (...)
  let isExpanded = isFalse;
  function toggleExpanded() {
    isExpanded = !isExpanded;
  }
</script>
<!-- (...) -->
  <div class="icon-holder">
    <svg viewBox="0 0 24 24" xmlns="http://www.w3.org/2000/svg" on:click={toggleExpanded}>
      <circle cx="12" cy="12" r="10" stroke="#5A67D8" stroke-width="0.6" fill="#F7FAFC"/>
      {#if isExpanded}
        <path d="m13 9.41v7.59a1 1 0 0 1 -2 0v-7.59l-2.3 2.3a1 1 0 1 1 -1.4-1.42l4-4a1 1 0 0 1 1.4 0l4 4a1 1 0 0 1 -1.4 1.42l-2.3-2.31z" fill="#5A67D8" stroke="#5A67D8" stroke-width="0.1"/>
      {:else}
        <path d="m11 14.59v-7.59a1 1 0 0 1 2 0v7.59l2.3-2.3a1 1 0 1 1 1.4 1.42l-4 4a1 1 0 0 1 -1.4 0l-4-4a1 1 0 0 1 1.4-1.42z" fill="#5A67D8" stroke="#5A67D8" stroke-width="0.1" />
      {/if}
    </svg>
  </div>
  {#if isExpanded}
    <div class="historical-prices" >
      <div class="table">
        <PriceRow label="1d" priceChange="-7.51" />
        <PriceRow label="1w" priceChange="-5.79" />
        <PriceRow label="1m" priceChange="-0.86" />
        <PriceRow label="3m" priceChange="11.36" />
        <PriceRow label="6m" priceChange="145.42" />
        <PriceRow label="1y" priceChange="45.20" />
      </div>
    </div>
  {/if}
The interesting stuff happens on the svg. on:click adds an event listener that will be triggered on click events. If we wanted to trigger it on hover, we'd write on:hover.
(Note how it was enough to wrap the one path element in the conditional – it's all just html.)
That works: the historical prices are hidden by default and get shown when the user expands the panel. We'll now code towards having the price change calculated by the PriceRow component and then fetching and displaying real values in the historical prices panel.
Reactive assignments – again
If we want PriceRow to calculate the price change, we have to pass in the historical price and the current price:
<div class="historical-prices" >
  <div class="table">
    <PriceRow label="1d" price="10342.07" currentPrice={price} />
    <PriceRow label="1w" price="10283.19" currentPrice={price} />
    <PriceRow label="1m" price="10241.35" currentPrice={price} />
    <PriceRow label="3m" price="10597.86" currentPrice={price} />
    <PriceRow label="6m" price="8379.70" currentPrice={price} />
    <PriceRow label="1y" price="6555.33" currentPrice={price} />
  </div>
</div>
We can now calculate the price change "locally", in the PriceRow component that displays it:
<script>
  export let currentPrice;
  export let price;

  function priceChange() {
    let p = parseFloat(price);
    return ((currentPrice - p) / p) * 100;
  }

  $: priceChange = round(priceChange());
</script>

<div class="table-row">
  <label>{label}</label>
  <span>{priceChange}%</span>
  <div class="table-cell">
    <IconArrow fill="#5A67D8" stroke="#5A67D8" strokeWidth="0.1px" rotation="{hasPriceIncreased ? -135 : -45}" />
  </div>
</div>
That will work if the passed-in price and currentPrice never changes but there's a bug in the declaration of priceChange (and if you've read the previous blog post in the series, you might already know what's wrong). Its dependencies cannot be inferred so Svelte doesn't know what it should react upon – when should priceChange be re-calculated.
It should be defined in a way so that the dependencies are explicit in the definition:
function priceChange(current, old) {
  let oldPrice = parseFloat(old);
  return ((current - oldPrice) / oldPrice) * 100;
}

$: priceChange = round(priceChange(currentPrice, price));
Let's see if we got this right by fetching the real historical prices via a network request.
Showing real prices
We need to do some restructuring in CryptoCard to be able to fetch and hold several prices and pass them to the PriceRows for display:
<script>
  import { format, subDays } from 'date-fns';

  let currentPrice = null;
  let prices = {};
  let labelMapping = {
    '1d': 1,
    '1w': 7,
    '1m': 30,
    '3m': 90,
    '6m': 182,
    '1y': 365,
  };

  async function updateCurrentPrice() {
    isLoadingPrice = true;
    let priceInfo =	await fetch(`https://api.coinbase.com/v2/prices/BTC-USD/spot`).then(r => r.json());
    isLoadingPrice = false;
    currentPrice = priceInfo.data.amount;
  }

  function hideHistoricalPrices() {
    isExpanded = false;
  }

  async function showHistoricalPrices() {
    isExpanded = true;
    for (let label in labelMapping) {
      let days = labelMapping[label];
      let date = format(subDays(new Date(), days), 'yyyy-MM-dd');
      let priceInfo = await fetch(`https://api.coinbase.com/v2/prices/BTC-USD/spot?date=${date}`).then(r => r.json());
      prices[label] = priceInfo.data.amount;
    }
  }
  // (...)
</script>

<div>
  <div class="icon-holder mx-auto relative dented">
    <svg viewBox="0 0 24 24" xmlns="http://www.w3.org/2000/svg" on:click={isExpanded ? hideHistoricalPrices : showHistoricalPrices}>
      <circle cx="12" cy="12" r="10" stroke="#5A67D8" stroke-width="0.6" fill="#F7FAFC"/>
      {#if isExpanded}
        <path d="m13 9.41v7.59a1 1 0 0 1 -2 0v-7.59l-2.3 2.3a1 1 0 1 1 -1.4-1.42l4-4a1 1 0 0 1 1.4 0l4 4a1 1 0 0 1 -1.4 1.42l-2.3-2.31z" fill="#5A67D8" stroke="#5A67D8" stroke-width="0.1"/>
      {:else}
        <path d="m11 14.59v-7.59a1 1 0 0 1 2 0v7.59l2.3-2.3a1 1 0 1 1 1.4 1.42l-4 4a1 1 0 0 1 -1.4 0l-4-4a1 1 0 0 1 1.4-1.42z" fill="#5A67D8" stroke="#5A67D8" stroke-width="0.1" />
      {/if}
    </svg>
  </div>
</div>
We store the historical price values in prices, keyed by label (`1d`, 6m). We split apart showing and hiding the price panel as we fetch the historical prices only when the panel is opened. Finally, let's see the bit that displays them:
<div>
  <!-- (...) -->
  {#if isExpanded}
    <div class="historical-prices">
      <div class="table">
        {#each Object.keys(prices) as label}
          <PriceRow {label} {currentPrice} price={prices[label]} />
        {/each}
      </div>
    </div>
  {/if}
</div>
There are two new things in this snippet.
The first is that #each can take any JavaScript expression that returns an iteratable. Here, we loop through the keys of the prices object, the time labels. The second is a shorthand. Instead of writing `label={label}`, we can use the {label} shorthand which expands to the same. This is effectively JavaScript's Enhanced Object Literals in Svelte markup.
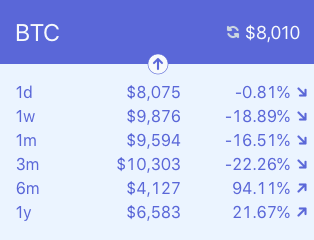
Our historical price panel is now fully(?) functional:

Next up
One thing we should definitely improve is that due to the await in showHistoricalPrices the expansion of the historical prices panel is blocked until all historical prices have been fetched. That might result in a bad user experience if the network requests have some delay.
So we'll improve this part of our app next.


