Coming closer to understanding D3's data joins

This is one of those posts where I'll describe the challenge I've faced and how I overcame it, so that you, dear reader, can hopefully learn how not to get bogged down with the same problem.
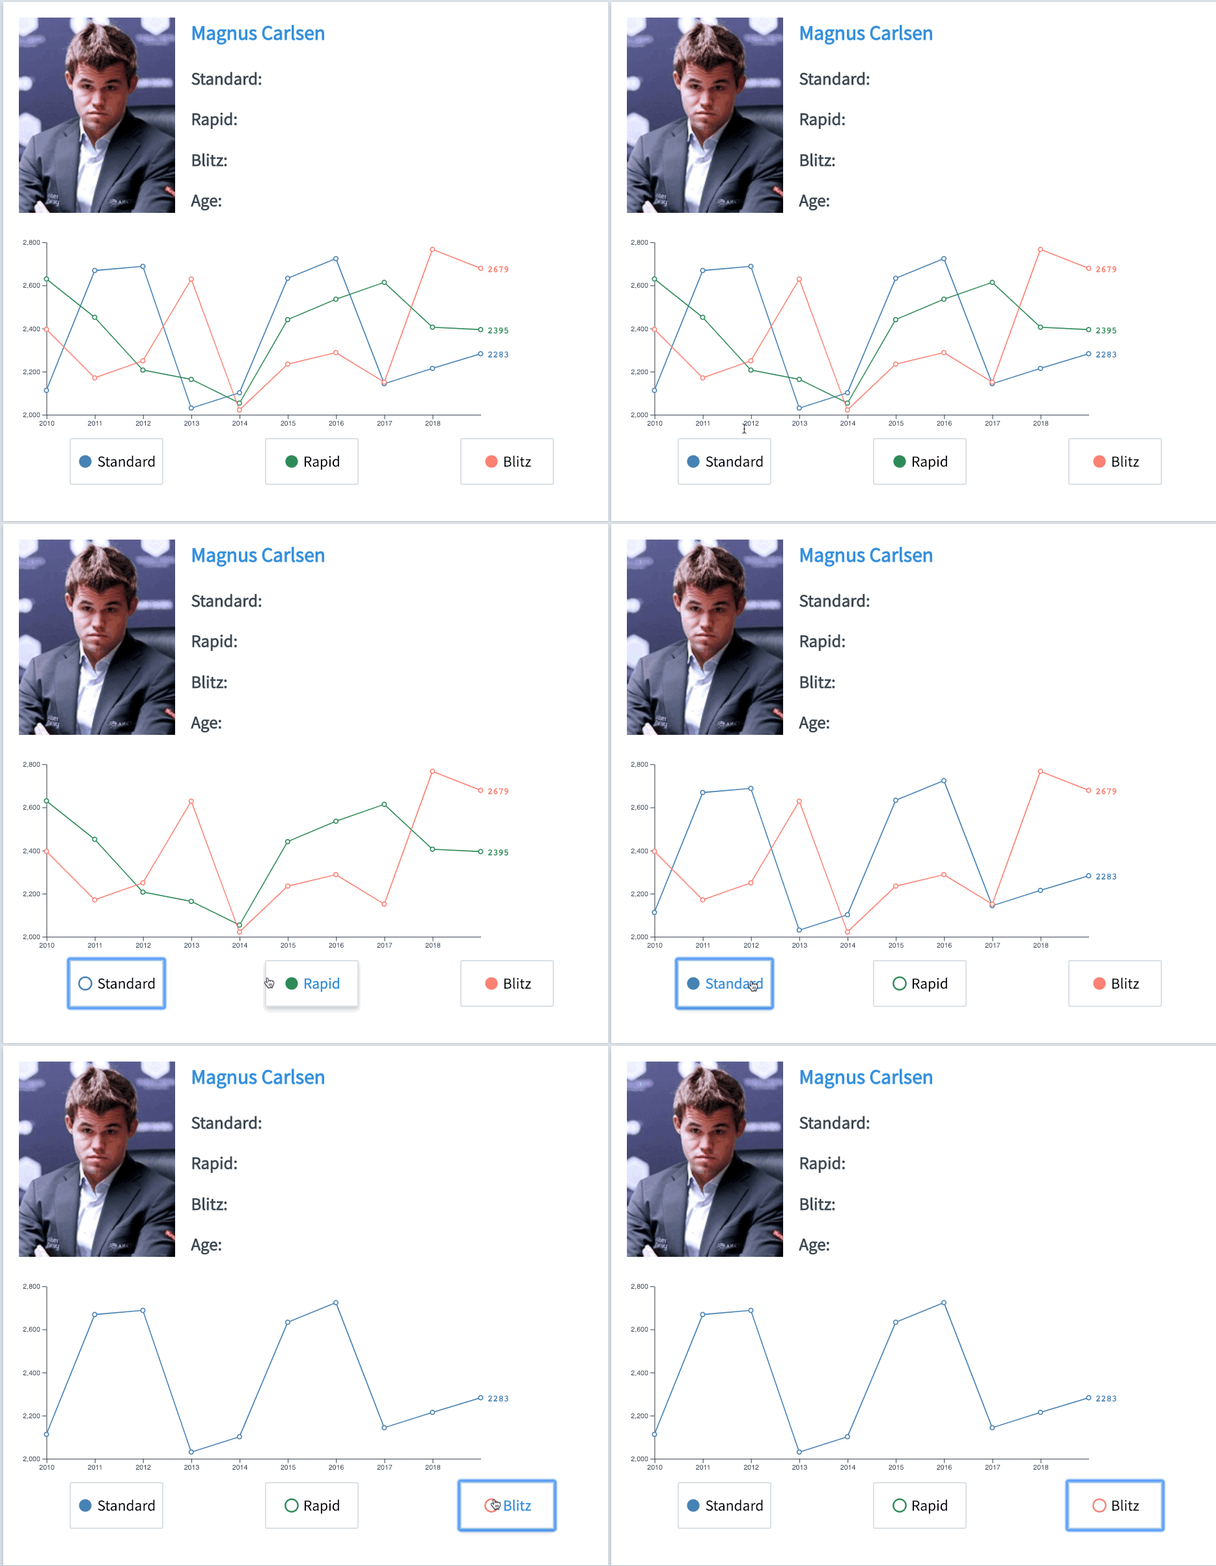
The issue was that the chart on the Player details page nicely rendered the lines for each chess time format (standard, rapid and blitz) but when toggled by the buttons beside the chart, the corresponding lines didn't always appear/disappear.
The chat component received the selected data points as its selectedLines attribute. I used this to create the main "D3 data join". The article by D3's creator, Mike Bostock, does a very good job at explaining what a data join is and since it's quite short, too, I recommend you give it a read.
In short, you join the data points in your data set with (html) elements that produces three sets: the update selection is the data points where there's a corresponding element, the enter selection is where the element is missing and the exit selection is where the element is there but the data point is missing.

So on the initial rendering of the chart component, all lines are in the enter selection. At that point, there's nothing rendered on screen, so the set of elements is empty. And it'd worked fine with the following code, all lines were nicely drawn.
// app/components/line-chart.ts
svg.selectAll('.line')
    .data(this.selectedLines);
  .enter()
  .append('g')
    .attr('fill', (d: LineData) => d.color)
    .attr('stroke', (d: LineData) => d.color)
    .attr('stroke-width', 1.5)
However, when one of the chess formats was deselected by clicking the corresponding button, the corresponding line didn't disappear. What's more, more lines were laid on top of each other, which was hard, but not impossible, to see on screen (because they were drawn in the exact same place).
It took me a while to figure out what was wrong. The join was established between the data items in this.selectedLines (each chess time format had its own line) and the SVG g tags having a line class, as established by the svg.selectAll call. I didn't however add the line class to those g tags so the next time, when this.selectedLines have changed, everything again fell in the enter selection because there no corresponding items were found for any line item that had a line class. So all the lines were rendered anew.
The fix, as in lots of cases that take hours to figure out, was a single line. I needed to add the line class to the g tags so that D3 data joins can work their magic:
// app/components/line-chart.ts
svg.selectAll('.line')
    .data(this.selectedLines);
  .enter()
  .append('g')
    .attr('class', 'line') // this line saved the day!
    .attr('fill', (d: LineData) => d.color)
    .attr('stroke', (d: LineData) => d.color)
    .attr('stroke-width', 1.5)
The magic which, that day, I came one step closer to understand.


